
ECG Interpretation Basics
The only defense against missing subtle, life-threatening pathology on a 12-lead ECG is a rigid, systematic approach. Looking straight at the ST segments guarantees you will miss important clues in the intervals.
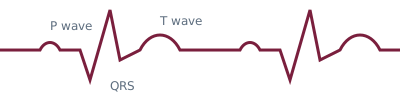
The Systematic Approach (Rule of 6)
1. Rate & Rhythm
- Rate: 300 / number of large squares between R-R (if regular). Or count number of R waves in a 10-second rhythm strip and multiply by 6.
- Rhythm: Is there a P wave before every QRS? Is there a QRS after every P wave? Are the P waves upright in leads I, II, aVF (Sinus Rhythm)?
2. Axis
Look at leads I and aVF.
- Positive in I, Positive in aVF = Normal Axis
- Positive in I, Negative in aVF = Left Axis Deviation (Check Lead II: if negative, it's pathological LAD)
- Negative in I, Positive in aVF = Right Axis Deviation
3. Intervals
- PR Interval: 120-200 ms (3-5 small squares). Short = WPW. Long = 1st degree AV block.
- QRS Duration: < 120 ms (3 small squares). Wide = Bundle Branch Block, Ventricular rhythm, Hyperkalemia.
- QTc: < 440 ms (men), < 460 ms (women). Use our QTc Calculator to correct for heart rate.
4. Hypertrophy
LVH (Sokolow-Lyon): S wave in V1 + R wave in V5 or V6 > 35 mm. Note: Voltage criteria are poorly specific in young, thin individuals.
5. Ischemia/Infarction (ST-T changes)
Assess territorially, not numerically.
- Inferior (RCA): II, III, aVF
- Lateral (LCx/LAD): I, aVL, V5, V6
- Anterior (LAD): V1-V4
Look for ST elevation (injury), ST depression (ischemia/reciprocal change), T wave inversion, and pathological Q waves (infarction).
6. The Rest
Check for miscellaneous findings: U waves (hypokalemia), Osborn waves (hypothermia), Delta waves (WPW).